I was recently triggered by the Collatz conjecture – also known as the Syracuse conjecture. As I wanted to learn a few bunches of new web technologies (Bootstrap, Webpack, Chart.js), I decided to start a simple project on the Collatz theme in order to get a new experience.
The Collatz conjecture involving the Syracuse function is still an unproven mathematical problem. With my website, you can visualize the Syracuse function for a given initial number.
TRY IT: collatzvisualizer.42borgata.com
Bootstrap / Webpack / Sass / Chart.js / Javascript / HTML / CSS
Intro
I was recently triggered by the Collatz conjecture – also known as the Syracuse conjecture. As I wanted to learn a few bunches of new web technologies (Bootstrap, Webpack, Chart.js), I decided to start a simple project on the Collatz theme in order to get a new experience.
The Collatz conjecture involving the Syracuse function is still an unproven mathematical problem. The Syracuse function can be defined as follows.
Syracuse function:
- while x != 1
- if x is even
- divide x = x / 2
- else
- x = x * 3 + 1
- if x is even
Results
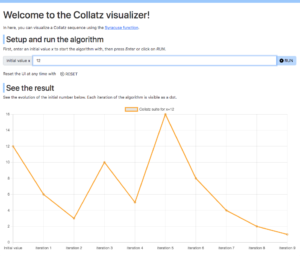
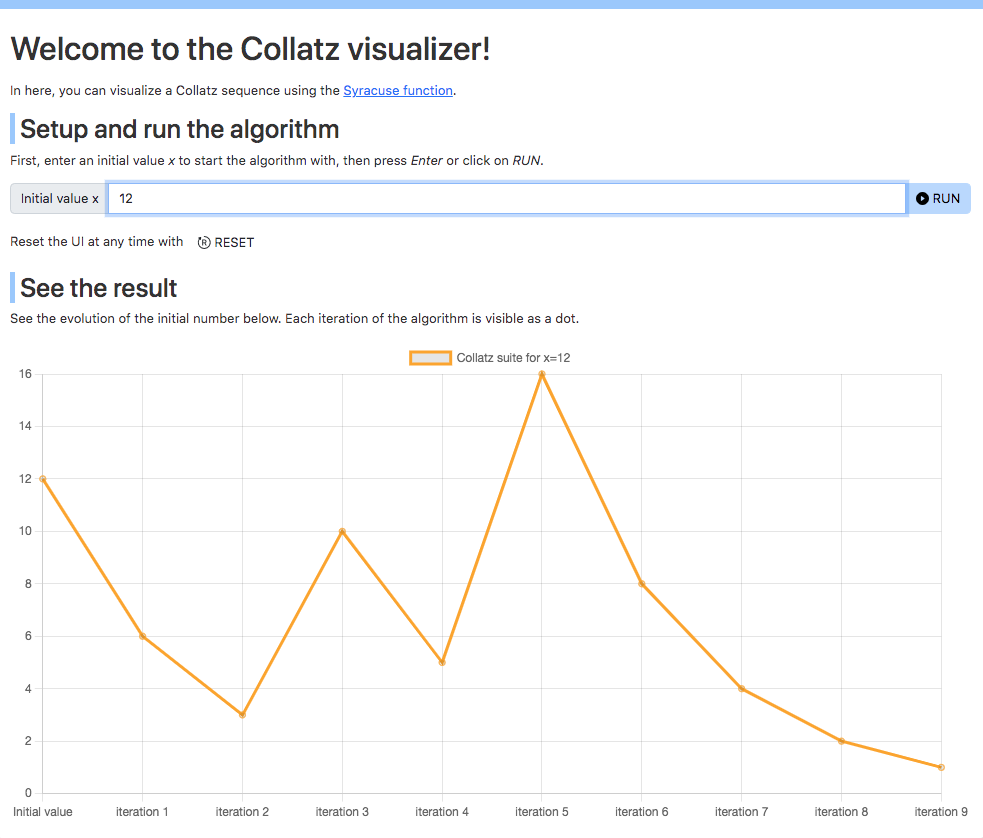
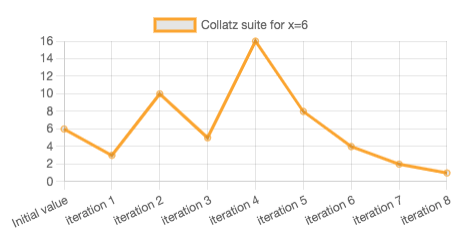
You can see below the first result of this exercise. Users can set an initial value for x and run the algorithm by pressing Enter or clicking on the RUN button. Once the algorithm is run, the evolution of x is shown as a polyline.
Conclusion
Working on this small project was more than interesting. By choosing Boostrap/Webpack/SASS/Chartjs I had to dive into the build system. Knowing Angular well, I know that those kinds of frameworks are powerful, but they can also blind you by taking care of many (too much?) things in the background. For example, liked to set up my app.js module and link it myself from main.js using import(), and also set up the webpack configuration.
For the future of this project, I see multiple options.
Some possible improvements:
- Do multiple runs and show many curves in the chart.
- Navigate into the chart to zoom to specific areas.
- Button to share a run as a link.
- Experiment with different types of charts.
Links
- website: https://collatzvisualizer.42borgata.com
- code source: https://github.com/berdal84/collatz-visualizer.git