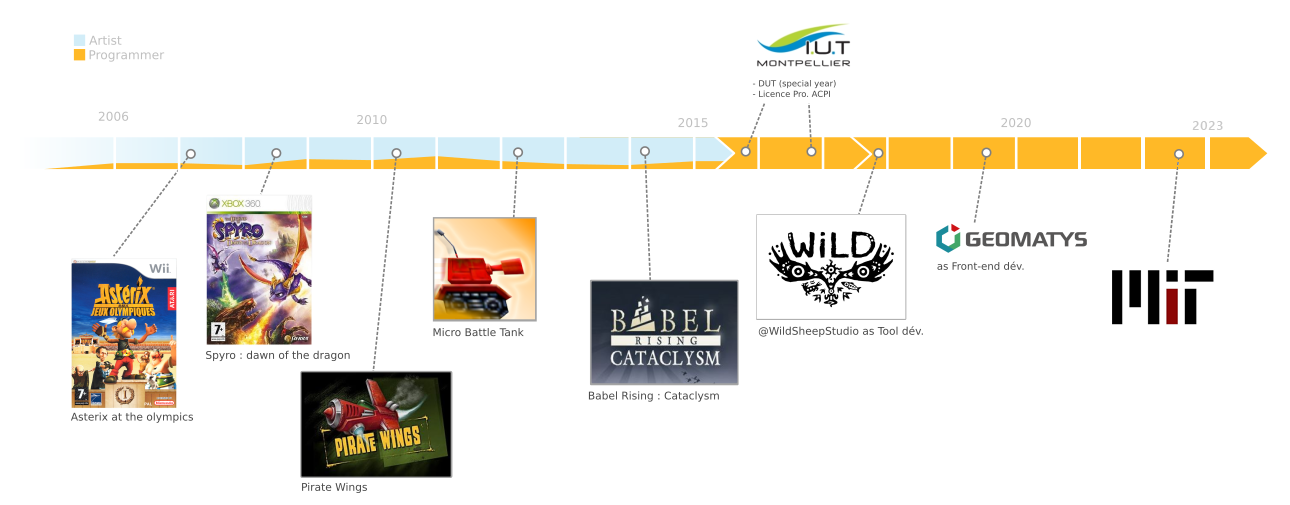
CRIPT | Polymer Research

Since August 2022, I am working as a Front-end Software Engineer for polymer research in MIT (ChemE dept.).

« The Community Resource for Innovation in Polymer Technology (CRIPT) provides a platform for people working in polymer science and engineering to capture and share data. CRIPT is led by a team at the Massachusetts Institute of Technology (MIT) along with collaborators in Academia, Industry, and Government, with support from the Convergence Accelerator Program of the National Science Foundation (NSF) »

sources: criptapp.org, publication

My role:

  • Contribute and maintain a web app (React, Vite) and multiple libraries (TS, Rollup, npm)
  • Write ingestion scripts in TypeScript and Python (pandas, CRIPT SDK)
  • Create dynamic visualisations (React, Plotly)
  • Unit tests, e2e tests and CI scripts (Jest, Cypress, GithubActions)
  • Estimate tasks to help plan the production

React / Vite / Typescript / Plotly / Python / GitHub / Jest / Cypress / Docker

Collatz Visualizer

Collatz visualizer | Syracuse function with x=12

I was recently triggered by the Collatz conjecture – also known as the Syracuse conjecture. As I wanted to learn a few bunches of new web technologies (Bootstrap, Webpack, Chart.js), I decided to start a simple project on the Collatz theme in order to get a new experience.

The Collatz conjecture involving the Syracuse function is still an unproven mathematical problem. With my website, you can visualize the Syracuse function for a given initial number.

Browse collatzvisualizer.42borgata.com to try it.

Bootstrap / Webpack / Sass / Chart.js / Javascript / HTML / CSS

Read more…

Let’s try React!

Intro

After implementing the PHP backend working with the Angular front-end, I was curious about other front-end framework alternatives. I heard a lot about React and Vue, and I decided to choose React because of the low effort it seems to require to get quick results. I started to implement a simple page to display a joke slideshow, something close to the original Angular version, but with a slightly different style. The figure below shows a capture of the single page using React.

WIP React front-end | Joke slideshow

You can browse the page by following the link here, the source code is here. More info below.

Read more…

Jeu de mots v0.2 | Angular PHP /MySQL

Introduction

My website jeudemots.42borgata.com has been updated. I decided to add a backend!

Before the update, jokes were stored in a monolithic JSON, they are now saved in a database. The JSON format is still used, but jokes are transmitted in pages. Page size is a parameter, it can be adjusted depending on the context. Sometimes we need 10 jokes (for a list) sometimes only one (home page).

An administrator can review jokes online and publish them, he can also maintain easily the website.

Angular 13 / PHP 7.4 / MySQL / phpMyAdmin / XAMPP

Read more…

Mageek – an ImageJ Java Plugin

Recently, I had the opportunity to collaborate with Marcela Garita Hernandez (Senior Research Fellow at Mass Eye and Ear, Harvard Medical School) on a small Java plugin for the software Fiji (known as ImageJ, a scientific image manipulation program). The object of this collaboration was to write a piece of code to read microscope images, to transform and to save them in batch (to process multiple files in background).

Fig. 1 – Capture of Mageek v1.2.1 graphical interface,.
On the left the scanned file extensions, in the center the actual files and on the right side the options to configure the process. A status line shows vital information at the bottom.

For information, Mageek works with several microscopes and more precisely with several microscope file formats. In Fig 1. you can see 3 extensions selected: *.lif images comes from Leica, the *.czi from Zeiss and the *.nd2 are from Nikon.

image
Fig. 2 – Montage of 4 channels processed from the same *.czi source file.
Here the user choose Magenta, Red, Green and Blue LUT.
Read more…

Web-based Cartographic Client

Examind demo | Geomatys Youtube channel.

I worked 2 years and a half as a Frontend Software Engineer for the geospatial field in Geomatys (Montpellier, south France)

My main tasks were to:

  • Develop as a team a web-based cartographic client using the Angular framework using libraries (CesiumJS, MaterialDesign, etc. ) to increase the speed of delivering a such an application but with configurable options.
  • Implement CI/CD for our generic cartographic client using GitlabCI, docker, and bash to get a better quality code base (unit tests, end-to-end) and a ready-to-deploy application using docker images.
  • Maintain and improve an internal Angular library to aggregate our common code for reuse in all our projects.
  • Read and implement a graphic identity using open source image editors (vector and pixel), HTML, CSS and JS to produce accurate and beautiful proof of concept websites to unlock budgets.

Angular 2+ / Docker / Gitlab CI / Cesium JS / Typescript / NodeJS / IntelliJ IDEA

Read more…

Nodable v0.8

Today I publish a first version of Nodable v0.8. This version comes with a lot of changes.

To start, a picture is better than words:

Fig. 1 – Nodable v0.8 – User edit a value from the graph, Nodable updates the code.

You don’t know Nodable? check this out: Nodable website

What’s new ?

We handle now multiple instructions and conditional structures. This new feature has been developed in order to figure out how to symbolize the code flow? and how to deal with execution?

We decided to add new nodes to symbolize instruction, code block and scopes. These nodes can be connected with green links to express next-previous relation type.

Fig 2 – Two instruction nodes liked in green to express next/previous relation.
Read more…
1 2 3 4