Math & Science


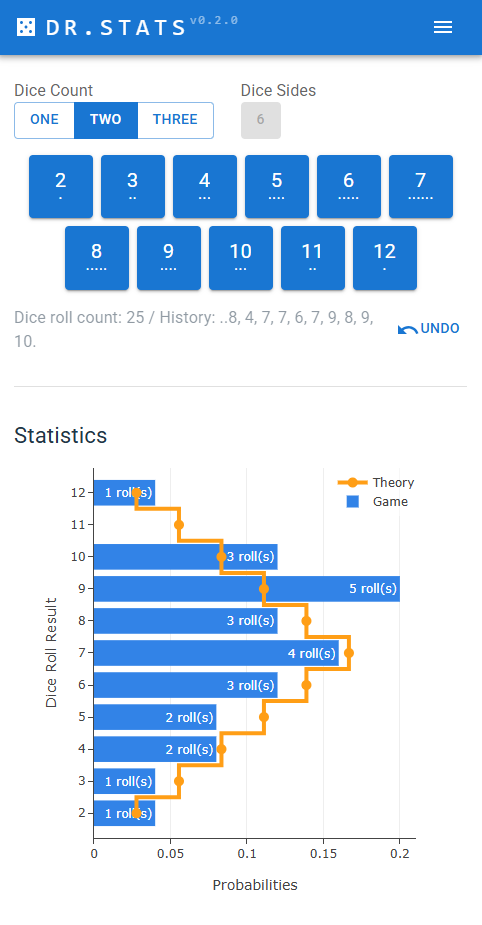
  • I wrote this webapp to follow the dice roll distribution during a Catan game. Of course it can works with any game that uses from 1 to 3 dices.

    Each time dices are thrown, user can register it by pressing one of the blue buttons. This has for effect to update in real time the game statistics as blue bars. The theoretical values are the orange line.

    User can visualize the history, and undo in case of errors. The state of the application is automatically saved/restored from the browser’s local storage.

    React / Vite / Plotly.js / Material Design


  • I was recently triggered by the Collatz conjecture – also known as the Syracuse conjecture. As I wanted to learn a few bunches of new web technologies (Bootstrap, Webpack, Chart.js), I decided to start a simple project on the Collatz theme in order to get a new experience.

    The Collatz conjecture involving the Syracuse function is still an unproven mathematical problem. With my website, you can visualize the Syracuse function for a given initial number.

    TRY IT: collatzvisualizer.42borgata.com

    Bootstrap / Webpack / Sass / Chart.js / Javascript / HTML / CSS

    (suite…)